
October 14 @ 6:00 pm – 7:00 pm EDT
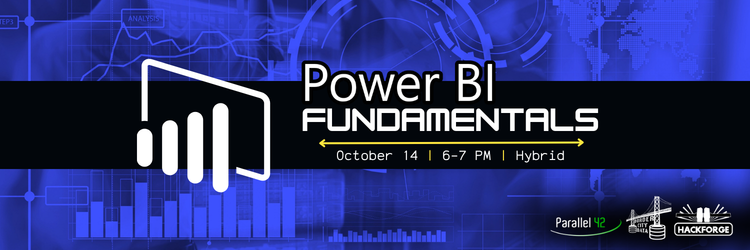
📍 Hackforge HQ (300 Ouellette Ave, Unit 210) & Online Via Zoom
💻👥Hybrid
💲 Free
Turn your data into dashboards!
Doug Sartori (Parallel 42 Systems) will guide you through taking raw data from spreadsheets or databases and using it to create interactive charts, graphs, and live dashboards, using Power BI.
Power BI is a free (as in $0) piece of Windows software that helps you use, see, and analyze data in powerful new ways.
Whether you’re looking for new ways of visualizing business insights, non-profit impact reporting, or want to track your personal finance and net worth, this is a great way to get started!
What you’ll learn about Power BI:
-The components & how to use it
-Where it fits in the Microsoft data ecosystem
What you’ll need installed/available:
-Docker (docker.com)
–Power BI Desktop (microsoft.com/en-ca/power-platform/products/power-bi/desktop)
–Data Puddle (github.com/p42systems/data-puddle)
This is intended to be a fundamentals course and attendees are highly encouraged to follow along on their own devices.
📆 October 14
🕦 6-7 PM
📍Hybrid (Hackforge HQ @ 300 Ouellette, Unit 210 & Online via Zoom)
🎟️ RSVP for Zoom Here
👥 RSVP in Person Below
💬 Interest Group: Border City Data
BCD: Power BI Fundamentals
Doug Sartori (Parallel 42 Systems) will guide you through taking raw data from spreadsheets or databases and using it to create interactive charts, graphs, and live dashboards, using Power BI.